In August we saw the first interest rate cut in New Zealand for four years. It was only a modest 0.25% drop and was largely expected but it hasn’t taken long for the high street banks to adjust their term deposit rates.
This time last year it wasn’t too difficult to secure an interest rate of around 6% for a one-year term deposit. Some banks offered even better rates than that as special limited time deals. As a result, term deposits became more and more popular for retail investors. In fact, according to the Reserve Bank, New Zealanders had accumulated the phenomenal sum of $136bn in term deposits as of the end of July 2024. Post the interest rate cut in August the popular banks and building societies have trimmed their rates quite noticeably. A check on the large bank websites as of the 4th of September reveals the following rates are now available for one year term.
WESTPAC: 5.05%
ANZ: 5.10%
BNZ: 5.10%
ASB: 5.10%
TSB: 5.20%
What About Listed Fixed Interest?
With interest rates expected to fall further, potentially as soon as later this year, these rates are likely to continue declining. Before rates
fall much further, consider moving some or all of your maturing term deposits into listed fixed interest investments such as bonds and preference shares?
Recent fixed interest issues have paid interest rates more than the currently available term deposit rates with terms from 5 to 7 years. Despite the long maturity dates you are not locked in for the term as bond issues are traded on the market like a share so you can sell some or all of your holdings at any time.
One of the advantages of listed fixed interest is the greater flexibility compared to term deposits. Listed fixed interest offers are made on a regular basis, and it is relatively straightforward to build a portfolio of different maturing at different times. A lump sum can be invested so you have a bond maturing each year for several years in the future. This is useful as it means you are never far from having the funds available to spend or reinvest, depending on your needs at the time.
You can also mix and match issuers. It is possible to build a quality portfolio of bonds maturing in different years from banks, airports, the New Zealand Government, property companies, or power generators.
Recent rates have been as high as 7.3% for a BNZ Preference share, 7.06% from Infratil, 6.22% from Auckland International Airport and 6.42% from a recent Mercury issue. New bonds are being listed regularly so do keep an eye out for an email from your adviser.
If you are interested in looking at alternative options for your term deposit holdings, do let your adviser know and they will be delighted to assist you.
What About Listed Property?
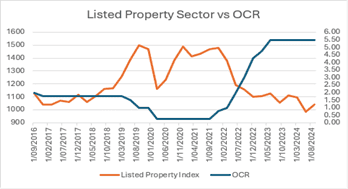
Whilst we are considering income and interest rates, we should check in on the listed property sector. This area of the market has had a very difficult couple of years. This sector has dropped 30% from the highs reached in 2021.
From the chart you can see that the listed property sector (orange) started to rally in 2019 as interest rates were cut. Except for the Covid sell-off, the sector remained elevated as interest rates were near zero, but was sold off aggressively as interest rates went up. Prices have rallied off recent lows on the prospect of lower rates. Given the reasonably attractive dividend yields from listed property, there could be opportunities for investors looking to maintain the income they’ve enjoyed from Term Deposits as well as have an opportunity for capital growth. Interested investors should talk to their adviser about the available options.
What About Equities?
Looking at 31 years of stock markets returns can offer a useful perspective on the returns that can be expected from the share market.
While the past cannot predict the future, studying the past can provide a baseline to help set expectations especially when it comes to the risk and the potential range of returns.
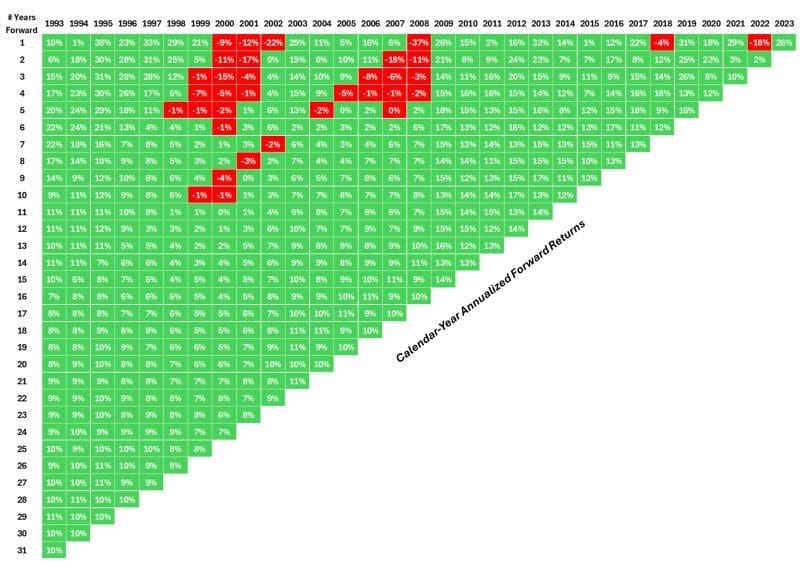
The table below is a different way to look at returns over various time horizons using the S&P 500 going back to 1993 (courtesy of awealthofcommonsense.com)
This is how to read this chart:
- Pick a starting year.
- Go down a number of years
- The corresponding square provides the annualized return from that starting point.
For example, the 9-year annual return starting in 1993 was 14% per year. Since 1993 there have been more good years in green than bad years in red but there were some painful periods for investors along the way when share markets had negative returns. There were no losses going out 11 years or more but investors starting from 1999 or 2000 would have had a decade of losses. There were also multiple time frames with losses going out 2, 3, 4 and 5 years into the future.
If investors are not comfortable investing for the long term five years can feel like an eternity in the share market.
The range of return outcomes is also interesting to consider.
- The 5-year annual returns ranged from -2% to 29%
- The 10-year annual returns ranged from -1% to 17%.
- The 15 years annual returns ranged from 4% to 14%
Bottom-line: Your experience in the stock market can vary drastically depending on your timing.
The good news is that long term investing removes a lot of variation from the equation.
The 31-year annual return from 1993 through 2023 was around 10% per year, right at the long-term averages. Not bad.